Imagine wiretapping eleven individuals suspected of being in a criminal network. By structuring who calls whom, at which time and place, we could possibly expose the most important person within that network. Does this example relate in any way to football? It does. The Konzepttrainer (‘concept coaches’) is taking on the role of forensic investigator by collecting data, analyzing patterns and finding a tactical countermove. To which teammate does a player pass the ball to or, more importantly, which player has a central role in the opposition’s build-up play? To study these passing patterns in detail we make use of a positional and passing network. A visual representation of intra-team passing relations. Sounds good, doesn’t it..?
However, one must note that a positional and passing network is a simplification of a complex and dynamic reality. In other words: some information is lost in visualizing the passing patterns of (parts of) a football game. Examples of interesting passmaps are those of 11tegen11, GSN and Soccermatics.
It is as if you are trying to draw a fine art print of Chagall, using a stain brush. It is impossible to capture everything in one single image, hence we are forced to make certain choices. Which details do you want to emphasize? What is less important? And which information is excluded?
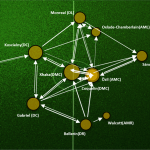
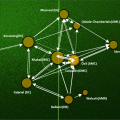
Before we take a closer look at these questions, we will briefly introduce the application of a positional and passing network, using Arsenal’s away game at Everton as our example. The orange circles in figure 1 represent the average passing positions of Arsenal’s starting eleven up until the first substitution.

As shown the circles differ in size and the size is determined by the number of passes. All positions are connected by white arrows. These arrows represents the number of successful passes between players. A thicker arrow means a larger amount of successful passes from player X to player Y.
A positional and passing network consists of different components. The first component within the network refers to the average position of a player.
Average positions in the passmap
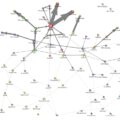
So, how do we calculate the average position of a player? Maybe the best way to explain this is to compare two players. Below all passing locations of Cech (white) and left-back Monreal (blue) are given. Each circle refers to the moment a pass is given and both successful and unsuccessful passes are included. All these passing locations boil down to a single location on the field. The orange circle shows the average position of a player.
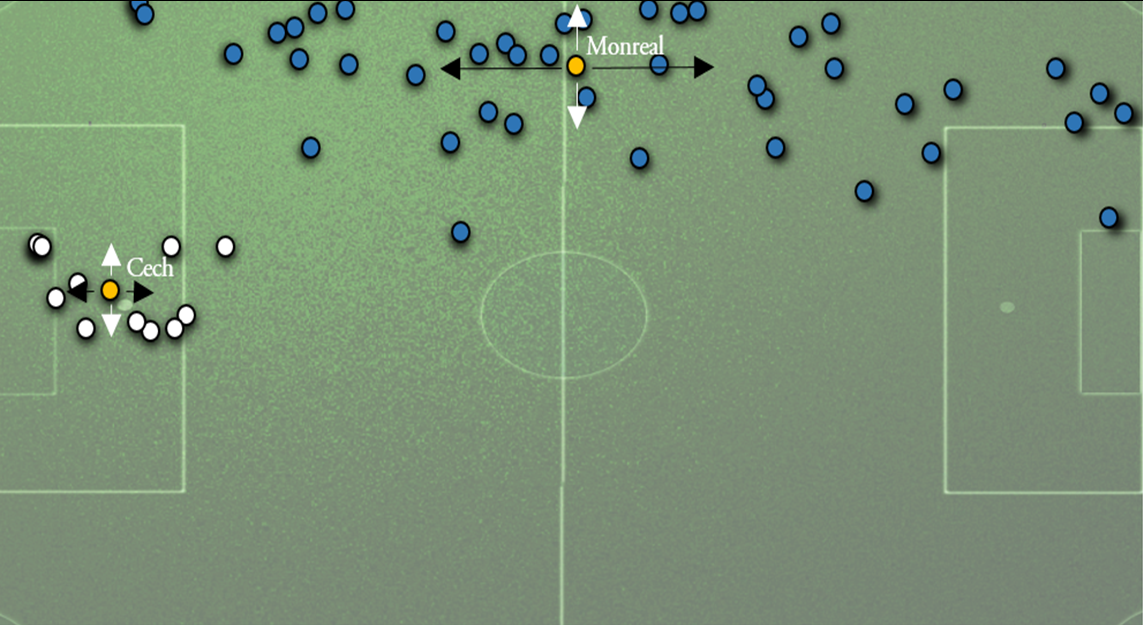
An important determinant of the average position is the spread and shape of the data (standard deviation, skewness, etc). Are the passing locations close to each other or do they vary a lot? The passing locations of Monreal (Figure 2) are more scattered than those of Cech. The passing locations of Cech are clustered together, which indicates a small spread.
The difference in spread is caused by the different roles players fulfill in there team. Cech (goalkeeper) will stay close to his own goal, while Monreal (left-back) gets involved in both attacking and defending by running up and down the sideline.
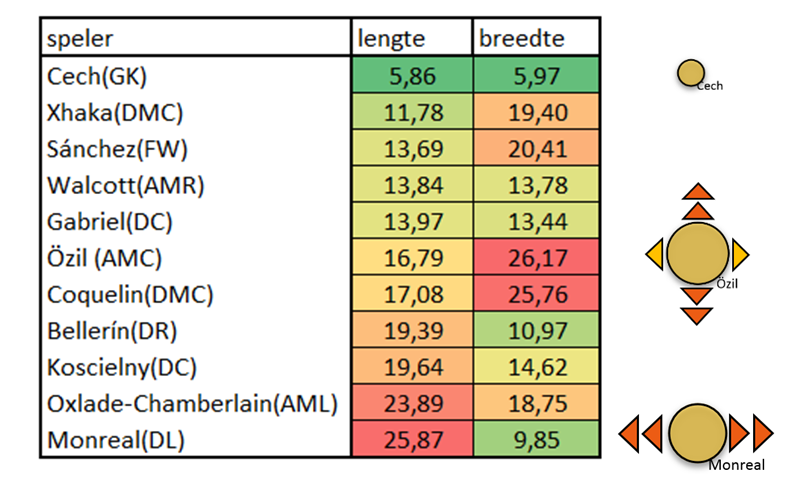
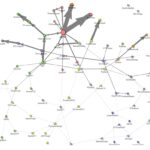
The figure below shows the spread (denoted as standard deviation) for Arsenal’s starting lineup. It is important to take this spread into account when interpreting the passing network. A large spread could possibly mean the average position is skewed. For example: 11tegen11 visualizes the asymmetry of passing locations in an excellent way by using distribution characters in his passing maps.
Think of wingers who like to change sides. For instance, at Real Madrid Ronaldo and Bale like to change positions every now and then. Bale plays during 90 minutes on both the left side and the right side of the field. By calculating his average position, you will get a position somewhere in the middle of the field. However, this is a misrepresentation of reality.
Another comparable problem occurs when a team changes formation. In the modern game teams stick increasingly less to a fixed game plan. During the course of 90 minutes teams might even change formation three of four times. What do we measure when a left-back shifts into midfield during play?
Other factors that play a role in determining the average position: an early substitution, a red card or a change in the opposition’s tactics (and your own team’s reaction to this change).
In determining the average positions the available data causes a problem as well. A player’s position is decided upon by his touches. Data providers, such as OPTA, do not own a tracking system which records every movement. If a player does not touch the ball, nothing is registered.
And a single touch is just one percent of a player’s total effort. In other words: A 1000 piece jigsaw puzzle of which 990 pieces are missing.
In the best case the average position of a player is decided upon by all of his touches. And a single touch is just one percent of a player’s total effort. In other words: A 1000 piece jigsaw puzzle of which 990 pieces are missing. Possibly, Özil’s true position lies a little to the right or left of his touch-based average position.
Passing within the passmap
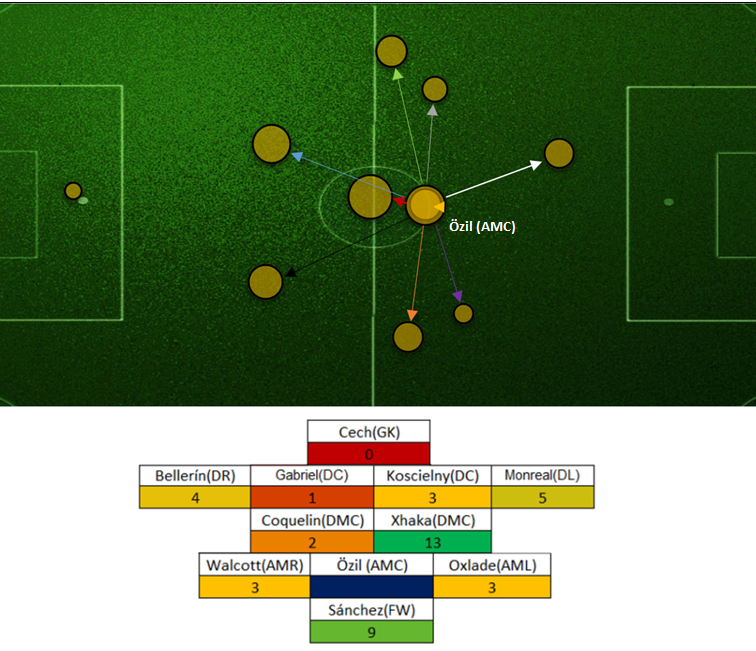
The second main component within the network refers to the passes between players. For instance, in 71 minutes Özil completed 43 passes. In the passmap the thickness of the arrow represents the number of successful passes. A thicker arrow equals more successful passes. There is a visual sense in the number of successful passes.
The total amount of successful passes is an outline of a team’s game play. In what way is the build-up play organized? Who is targeted in midfield? In answering these questions the pass map focuses on the aggregate number of passes. Quantity is more important than quality. And, in all honesty, this does not totally feel right. We do not see the difference between dangerous passes and the ones that are not. Moreover, we only take into account passes that were completed, but what about passes that were not? They stay out of the picture. And these type of passes are the ones that tell a different kind of story. A rather important one as well. These type of passes are generally quite risky and could have lead to a big scoring opportunity.
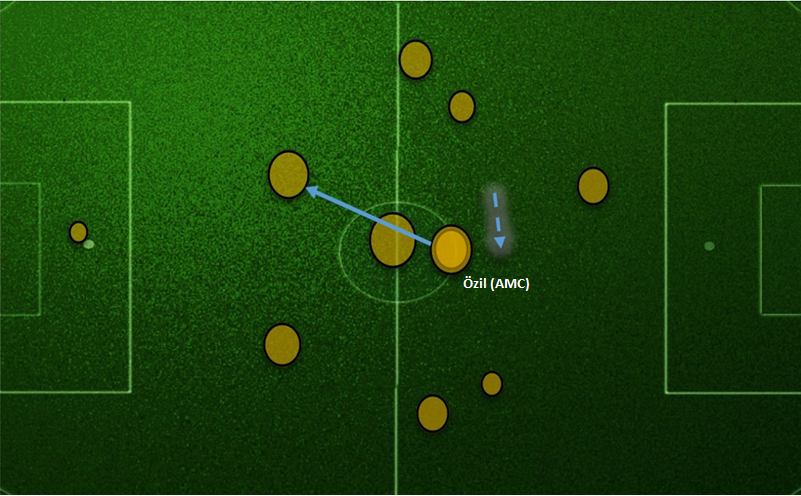
It is very hard to visualize the actual direction and length of the passes when displayed as an arrow between two average positions. In practice, almost none of the completed passes are sent from or received at the average positions as shown in Figure 5. This distortion might be explained best using an example of three passes Özil completed to Koscielny. The three successful passes are packed into the glowing dashed arrow.
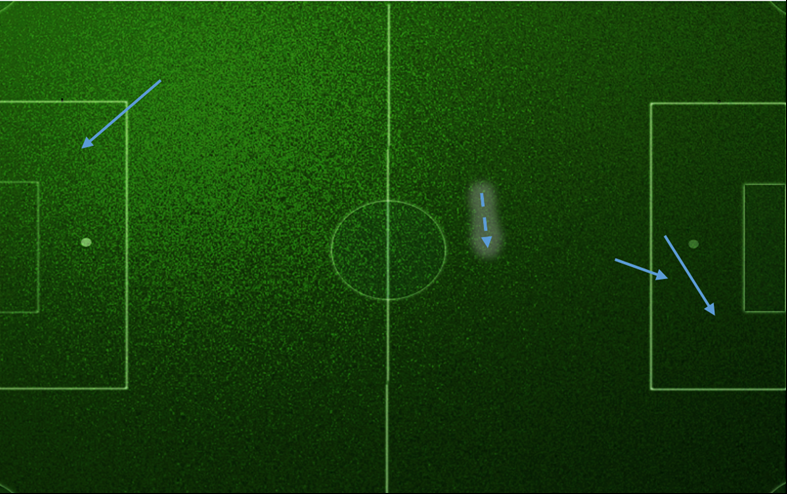
We paste this average passing line into the pass map. It becomes clear that the length and direction of Özil’s passes do not correspond with its true length and direction (Figure 6).
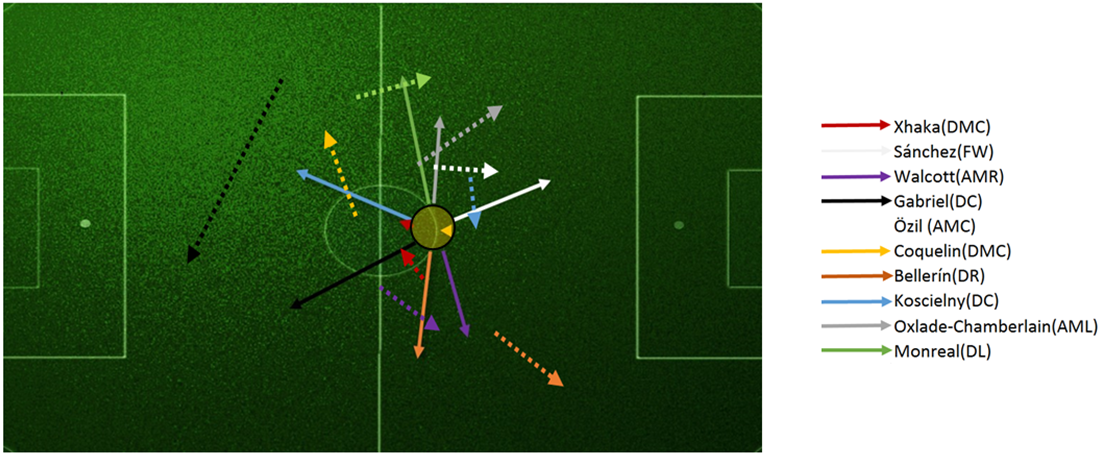
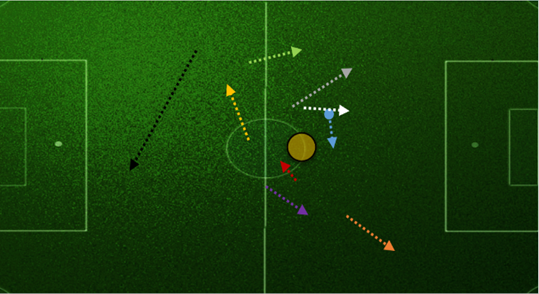
An overview of all of Özil’s completed passes is given in Figure 7. The dashed arrows represent the true average length and direction to his teammates, while the solid arrows equal the length and direction as shown in the passmap.
If the use of passing connections between players is so problematic, why don’t we show the true passing average (dashed arrows) instead? The answer to this question is actually very simple: by using the player’s positions as the start and finish of the passing line we are keeping a clear overview of who passes to whom. In a positional and passing network as shown in Figure 4 the passes are deeply embedded in the average player’s position.
Visibly this is very satisfying as passes originate from a fixed position. But what happens when we decompose the relationship between passes and position? Do we get a fairer view of the average pass? Definitely! Does the image become clearer? Not really, because the passes are not completed between the player’s positions anymore. For an individual player this should not be a huge drawback. However, a positional and passing network is not meant to focus on only one player but to analyze the collective organization. A team, that is. This way it is impossible to get eleven players and their corresponding interactions into one clear image.
From that point of view it is understandable that one would opt for the most pragmatic solution: the shortest passing route between the players’ positions in order to get around the problem of complexity. As you see, even in analyzing data we tend to form ‘elephant paths’.
Note. Data via Opta. A special thanks to Mark Wijnbergen, Jelle Leenders en Lisandro Isei.


Nog geen reacties
Geef je mening Cancel